
Soiling Snapshots:
Map Soiling Losses Across a Site
Account for soiling losses during commissioning and capacity testing
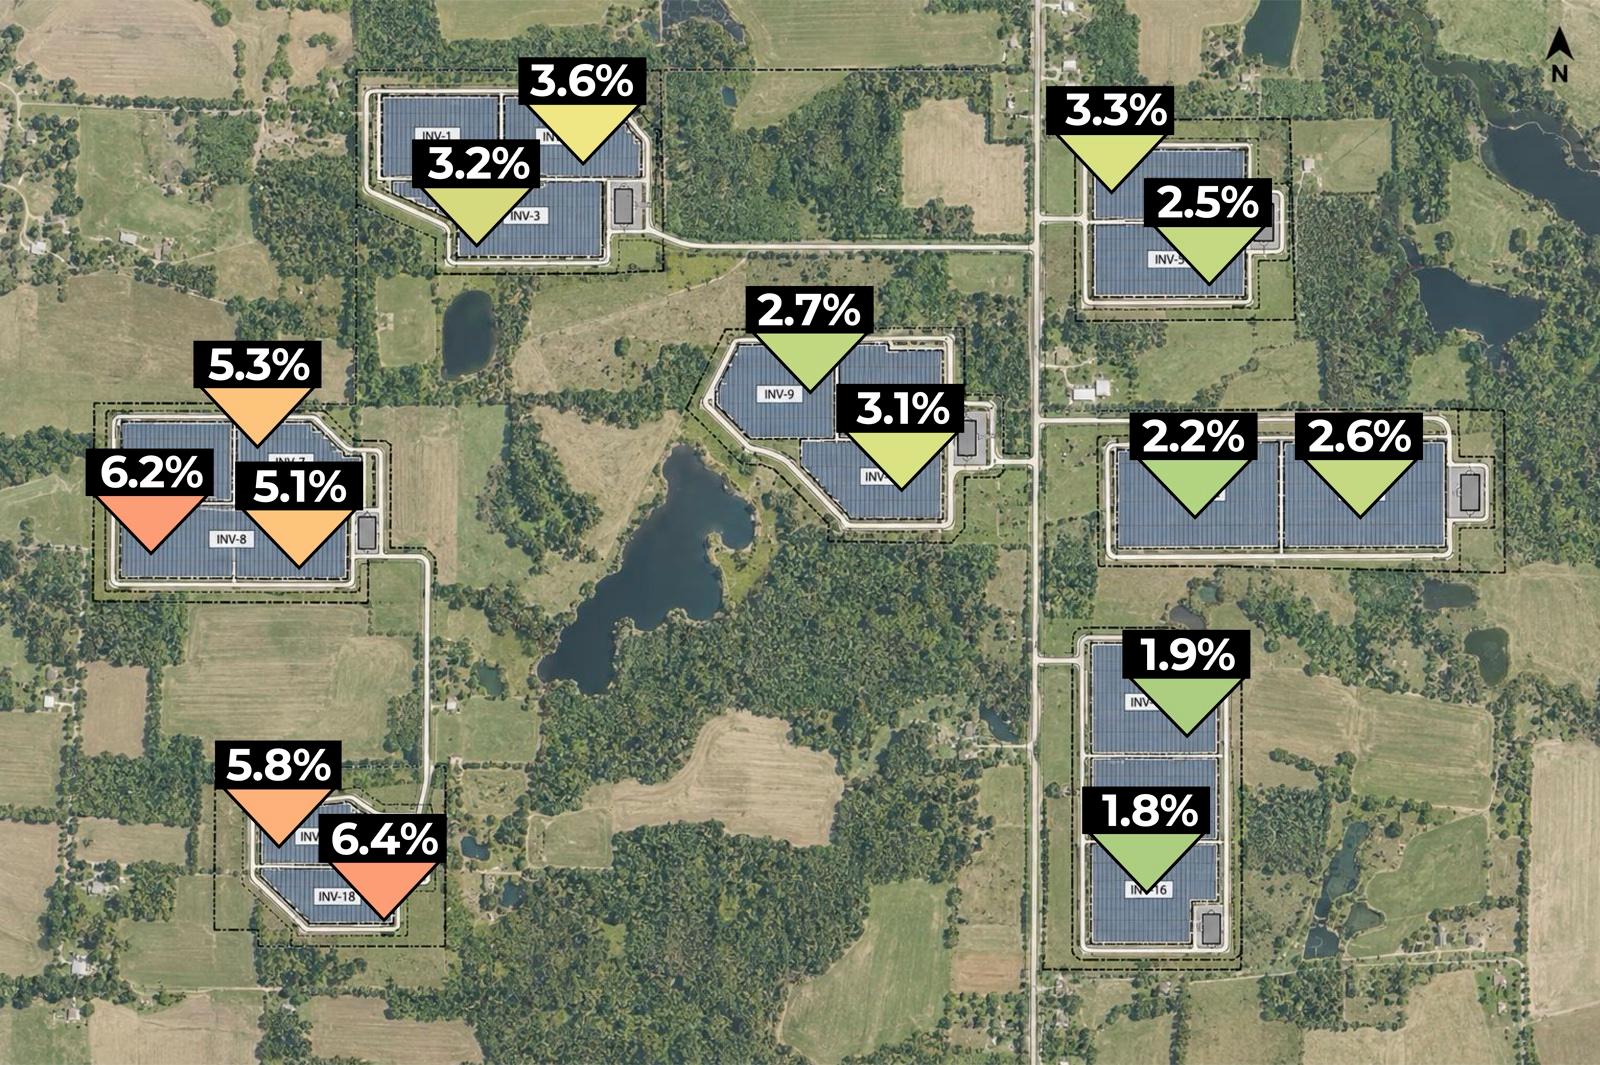
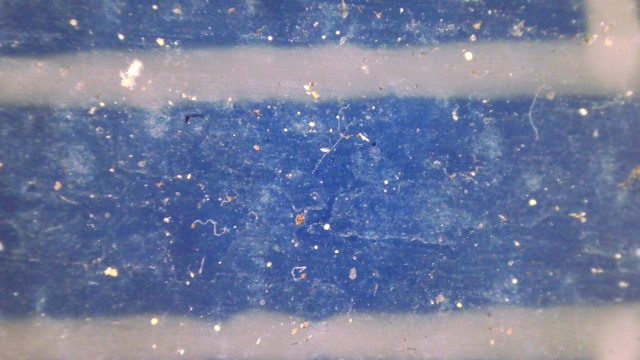
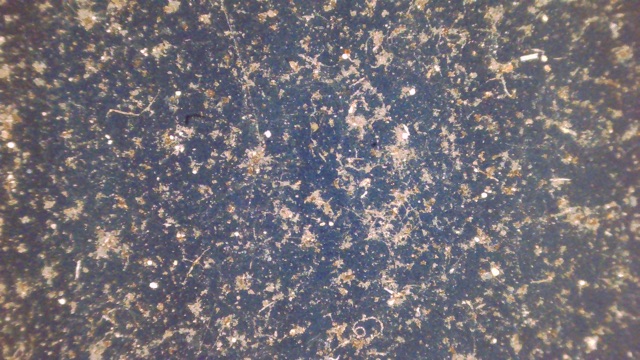
Our microscope-based analysis quantifies soiling losses, and the soiling source, across the regions of your site.
What you get with a Soiling Snapshot
- Soiling losses at 10–60 locations across the site
- A summary map that highlights any nonuniform soiling
- The types of soiling present, from construction dust to pollen and fungus, and how much rain is expected to remove
- Microscopes left on site, with technicians trained on data capture for ongoing measurements through commissioning
- >5 GW
- of solar capacity assessed to date with Soiling Snapshots
- 5–750 MW
- range in site sizes imaged in under a day
- ±1.3%
- soiling loss accuracy vs. IV curve traces
- <3 days
- to deliver the report (business days)
Advantages of our microscope-based soiling assessments
| Soiling Snapshots | IV Curve Tracing | |
|---|---|---|
| Uncertainty | Low | Medium |
| Representative of entire array | Yes | No |
| Assessment of soiling type (dust, fungus) | Yes | No |
| Back of module analysis | Yes | No |
| Requires clear skies | No | Yes |
| Requires working with live voltage | No | Yes |
| Requires additional data analysis | No | Yes |
Soiling sensors are often installed at different times than the panels, and deposition and growth on their small measurement areas can differ from those on full-size panels. Relying only on soiling sensor data at capacity testing adds uncertainty when every percent matters.
Preview
Preview